Photo credit: STRATUS
WatchITgrow is an online platform to support farmers in monitoring arable crops and vegetables more efficiently in view of increasing yields, both qualitatively and quantitatively. It is a collaboration platform for everyone in the sector, from growers, contractors and advisors to buyers.
WatchITgrow uses various types of data starting with satellite data combined with e.g. weather data, soil data, IoT data and field data provided by the farmer. These data are combined using new technologies such as big data analytics and machine learning to provide farmers with more timely and personalized advice. The platform offers numerous functions. It can be used to store field data: general information such as the variety, planting date, harvest date or more specific information on application of fertilizers, pesticides, irrigation…As a farmer you decide whether or not you share these data with your advisor, contractor, buyer…
WatchITgrow provides information on crop growth and development as observed from satellite images. From the greenness maps you can easily detect variability within your field and compare crops growing on different fields. By monitoring the weather data (temperature and rainfall) you can better assess the risk for production or quality losses at your fields. WatchITgrow also provides yield forecasts for 2 potato varieties, Bintje and Fontane, at field level. Finally, application maps for variable rate planting, irrigation, haulm killing and variable fertilization can be created.
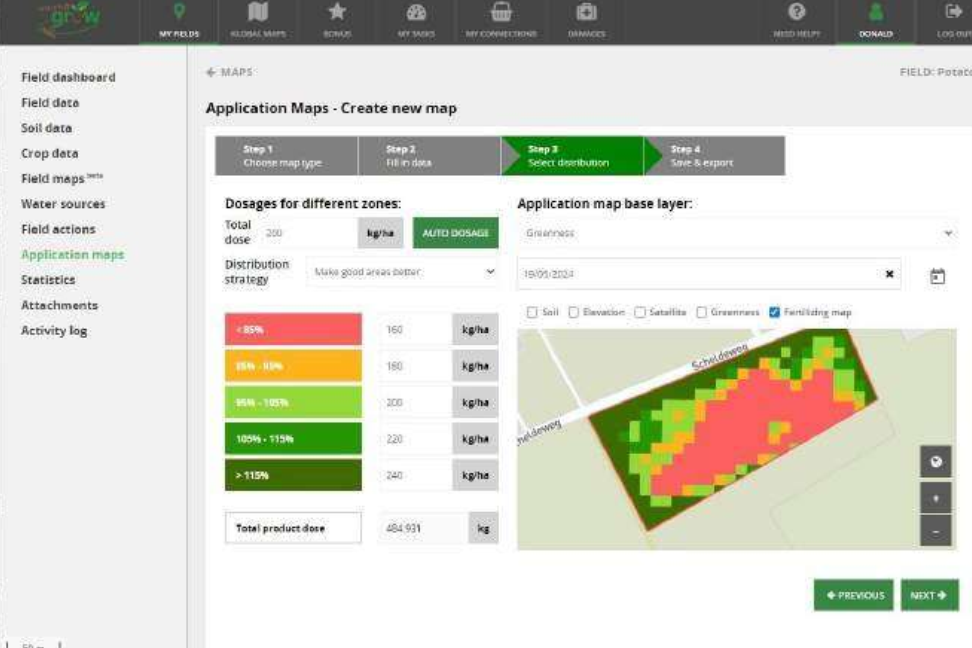
To create an application map for variable rate fertilization, different steps are followed. In the first step, the farmer selects the machine that will be used for fertilizing, the type of fertilizer (mineral, organic, compost) and the product(s) that will be applied. You can select one or more products from the list of existing (mineral) fertilizers or you can create your own product. If you choose the latter option, you can add minerals one by one. When adding the product, you are also asked to add the normal dose you would apply to the field, in kg/ha or l/ha. In step 2, by clicking on “Auto dosage”, the normal product dose is distributed over the different zones within the field according to the selected strategy. “Make bad areas better” applies a higher dose of fertilizer to zones with a low greenness index. When you select “Make good areas better” a higher dose will be applied to zones with a high greenness index. If needed, you can still change the dose.
To define the zones WatchITgrow uses greenness (fAPAR ) images derived from Sentinel-2 satellite images. The Fraction of Absorbed Photosynthetically Active Radiation (fAPAR) is a vegetation indicator that quantifies the fraction of the solar radiation absorbed by live leaves for the photosynthesis activity. It measures only to the green and alive elements of the canopy.
The greenness of each pixel in the field is compared with the median greenness of the field and attributed to one of the following 5 classes: <85%, 85-95%, 95-105%, 105-115%, >115% of the median value. In the last step you can enter the name of the application map and, optionally, an advice date for fertilizing. You can download the polygons and the respective fertilizer dose to be applied as a shapefile by clicking on the download button below or you can just save the map you created. These application maps can then be uploaded in the variable rate fertiliser technology.